
Totals for Active Sites Across All Domains
June 2000 - July 2012

Developer | June 2012 | Percent | July 2012 | Percent | Change |
|---|---|---|---|---|---|
Apache | 107,485,139 | 55.73% | 106,678,260 | 55.46% | -0.27 |
Microsoft | 23,464,661 | 12.17% | 22,848,388 | 11.88% | -0.29 |
nginx | 23,114,450 | 11.98% | 22,029,549 | 11.45% | -0.53 |
16,473,290 | 8.54% | 16,485,315 | 8.57% | 0.03 |
For more information see Active Sites
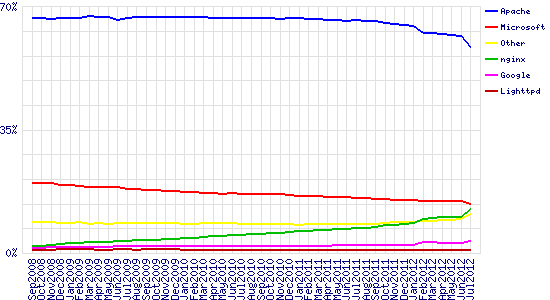
Market Share for Top Servers Across the Million Busiest Sites
September 2008 - July 2012
Developer | June 2012 | Percent | July 2012 | Percent | Change |
|---|---|---|---|---|---|
Apache | 614,721 | 61.75% | 582,721 | 58.50% | -3.25 |
Microsoft | 147,054 | 14.77% | 137,412 | 13.79% | -0.98 |
nginx | 102,449 | 10.29% | 124,427 | 12.49% | 2.20 |
28,498 | 2.86% | 33,822 | 3.40% | 0.53 |
Related
Related
Related

Don't want to miss out on updates?
Don't want to miss out on updates?
Don't want to miss out on updates?
Join our mailing list for regular blog posts and case studies from Netcraft.
Up next


Book a Demo Today
Learn more about Netcraft’s powerful brand protection, external threat intelligence, and digital risk protection platform.
Book a Demo Today
Learn more about Netcraft’s powerful brand protection, external threat intelligence, and digital risk protection platform.
Book a Demo Today
Learn more about Netcraft’s powerful brand protection, external threat intelligence, and digital risk protection platform.
Book a Demo Today
Learn more about Netcraft’s powerful brand protection, external threat intelligence, and digital risk protection platform.