Totals for Active Sites Across All Domains
June 2000 – June 2012
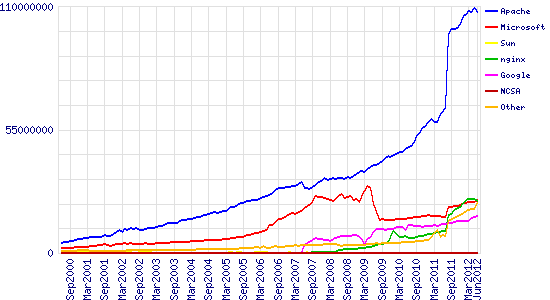
| Developer | May 2012 | Percent | June 2012 | Percent | Change |
|---|---|---|---|---|---|
| Apache | 109,278,620 | 57.02% | 107,485,139 | 55.73% | -1.29 |
| Microsoft | 22,803,442 | 11.90% | 23,464,661 | 12.17% | 0.27 |
| nginx | 23,938,754 | 12.49% | 23,114,450 | 11.98% | -0.51 |
| 15,855,806 | 8.27% | 16,473,290 | 8.54% | 0.27 |
For more information see Active Sites
Market Share for Top Servers Across the Million Busiest Sites
September 2008 – June 2012
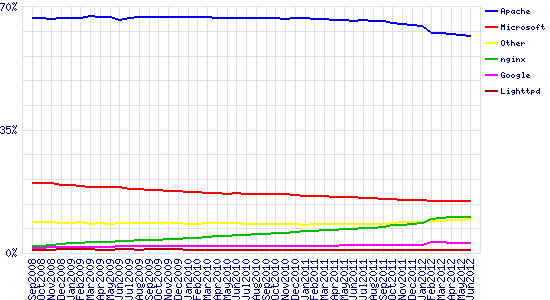
| Developer | May 2012 | Percent | June 2012 | Percent | Change |
|---|---|---|---|---|---|
| Apache | 617,430 | 62.02% | 614,721 | 61.75% | -0.27 |
| Microsoft | 146,974 | 14.76% | 147,054 | 14.77% | 0.01 |
| nginx | 100,417 | 10.09% | 102,449 | 10.29% | 0.20 |
| 29,071 | 2.92% | 28,498 | 2.86% | -0.06 |